data analysis
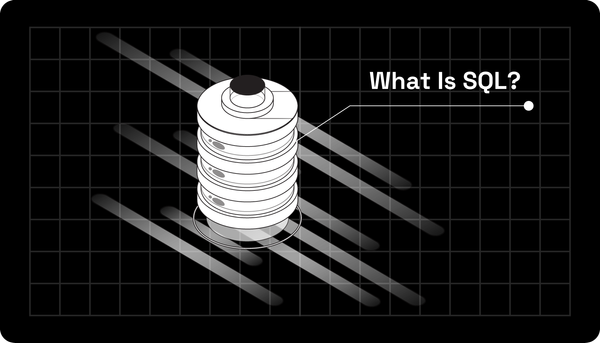
What is SQL? Structural Query Language Explained (What it is Used For)
Imagine interacting with databases to access information in seconds. This is where SQL empowers you to do just that.
data analysis
Imagine interacting with databases to access information in seconds. This is where SQL empowers you to do just that.
data analysis
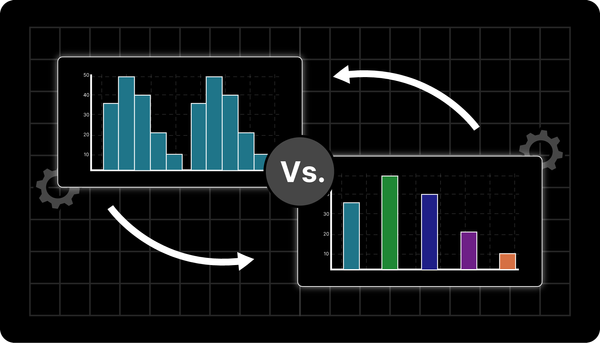
Histograms and bar charts are excellent for presenting complicated data. But when should you use them? Find out here.
data analysis
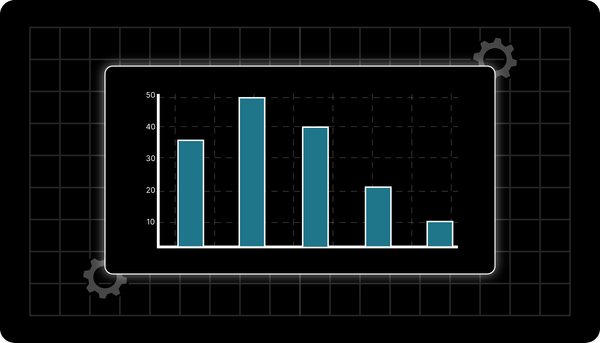
Learn what histograms are, their types, and how to use them in data analysis. See examples and applications to improve your data interpretation.